The first task undertaken with the gantry model is to run a normal modes analysis to find the first 10 mode shapes.
The video below shows animations of the first 10 modes. I have added a dashboard to keep track of the mode number, frequency and response plane. This model is interesting as the responses are either in the vertical plane, or the horizontal plane for the first 10 modes. There is no cross coupling.
Video 1 (3:18)
Please use the play, pause and timeline slider bar in the usual way. There may be a pause while the video buffers
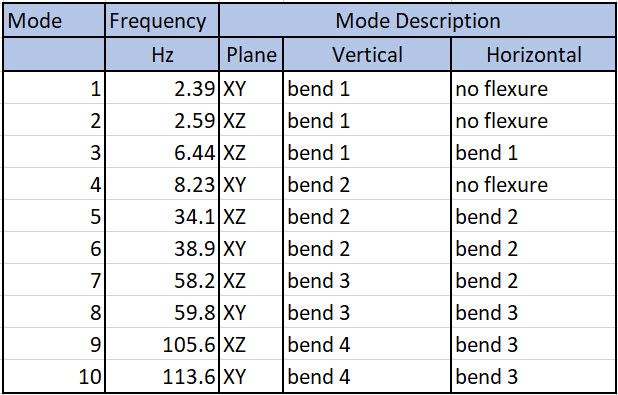
Here is a summary of the modes. The plane refers to the plane of response. Horizontal and vertical refer to the bending modes of the horizontal arm and the vertical pillar.
Gantry modal results table
The next task is to identify which modes are effected by the base mount connection to ground. This is a four point simply supported connection; quite a flexible connection.
The following video shows a close-up of the base region as we walk through the first 10 modes.
Video 2 (1.04)
The video below shows the base plate in isolation, and the response can be seen to increase as the higher frequencies (mode 6 to 10) start to play a stronger role.
Video 3 (0:43)
When the lesson is completed you may move on to the next lesson using the View Next button.
You may also return to the previous lesson using the View Previous button.
Alternatively, you can navigate around the course using the sidebar

Leave a Reply